If you’re managing your Facebook page wondering what’s working and what’s not working – I recommend you start with looking through your Page Insights. Your Page Insights is the first step to help make your Facebook page successful. Plus, it’s easy, free and pretty neat!
So What Is Page Insights?
Page Insights is the analytics behind your Page that will give you information about who is connected to you, and an overview of how they’re responding to the content you share.
Page Insights is are divided into the following sections:
- Overview
- Likes
- Reach
- Visits
- Posts
- People
Each section is filled with a ton of excellent information; below you will find all the available data under each section (or tab). It’s important to understand and know where and what data is available under each section. This will save you time when looking through your Insights.
Let’s Get Started
Simply click on Insights at the top of the screen. Alternatively, if you’re looking at your Page’s News Feed, click the Insights link in the left column. Keep in mind that insights are available after at least 30 people like your page.
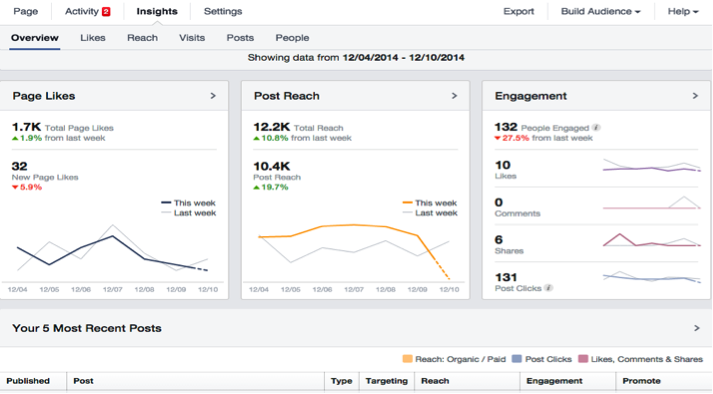
Overview:
The Overview tab gives you the most important data about your page at a glance, including new page likes, post reach, engagement for the last week, your five most recent posts, and pages to watch.
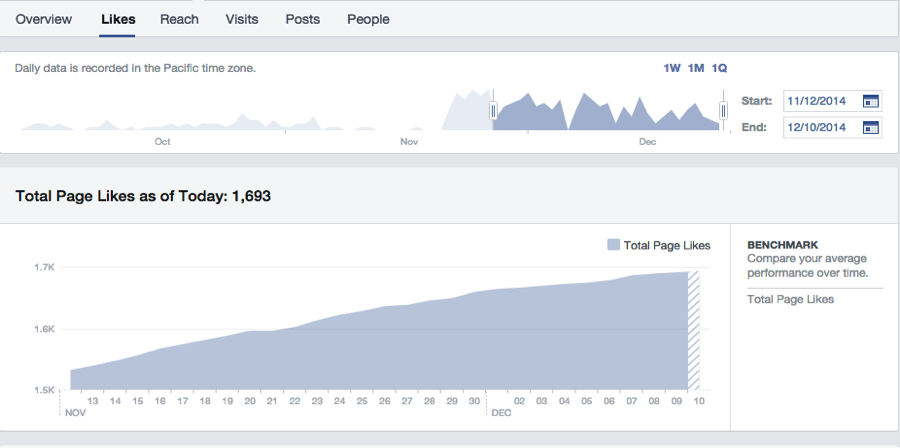
Likes:
The Likes tab shows your page’s fan growth. On this page you will see your Total Page Likes, Net Likes, and Where Your Page Likes Happened.
- Total Page Likes – this is where you can compare your average performance over time. You can use the date selector to view data from the last week, month, or quarter. You can also see the number of likes you had on a particular date.
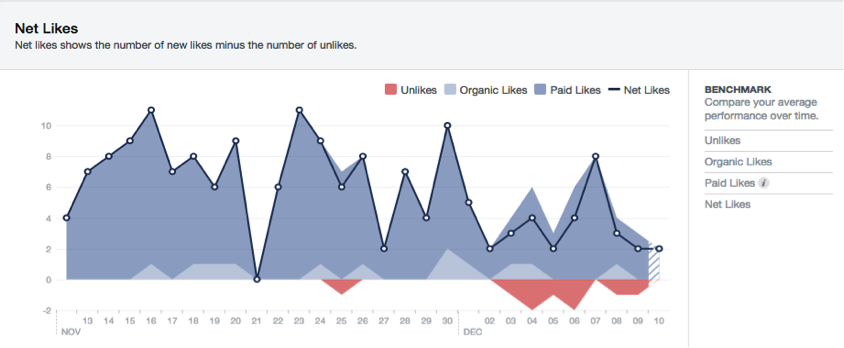
- Net Likes – Net Likes shows the number of new likes minus the number of unlikes.
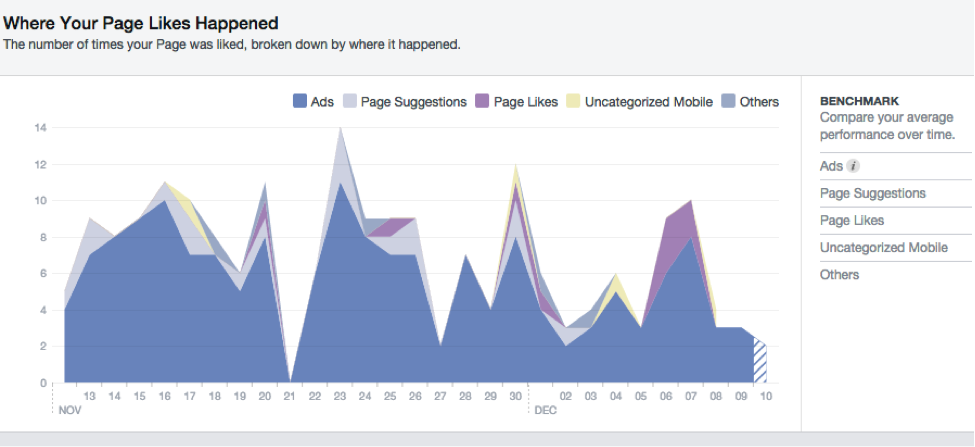
- Where Your Page Likes Happened – The number of times your Page was liked, broken down by where it happened. Where it happened includes, Ads, Page Suggestions, Page Likes, Uncategorized Mobile, and Others.
Reach:
Ever wonder how many people you are actually reaching with your content? Here is where you will see your Post Reach, Likes, Comments and Shares, Hide, Report as Spam and Unlikes, as well as your Total Reach.
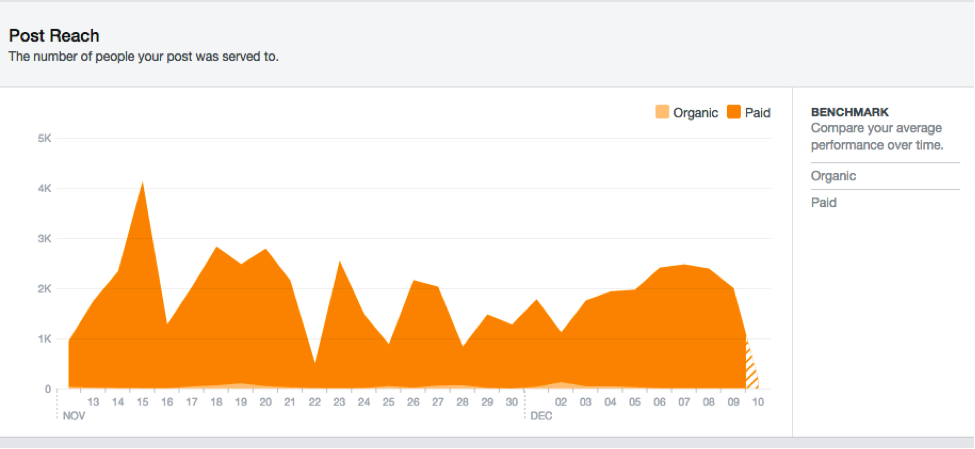
- Post reach – shows the number of people your post was served to – the ones who have seen the post whether they clicked on it or not. You can compare organic vs. paid.
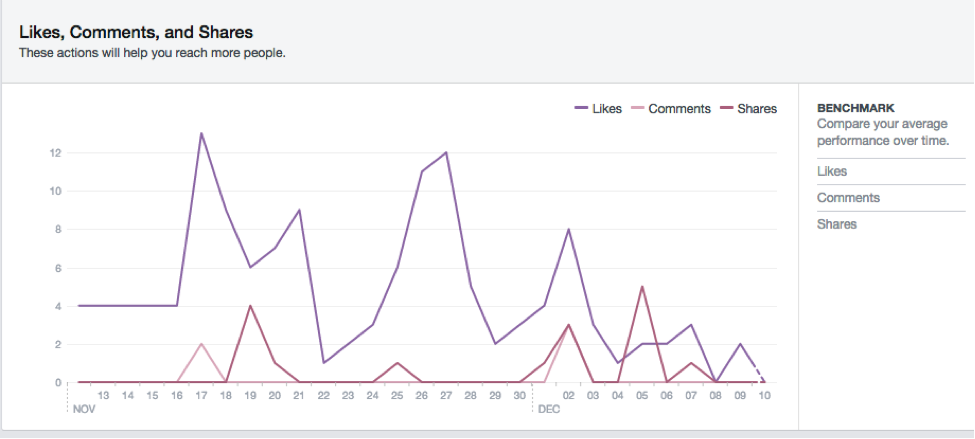
- Likes, Comments and Shares – this graphic shows the positive action happening on each of your Facebook posts – this data can help you learn how to reach more people.
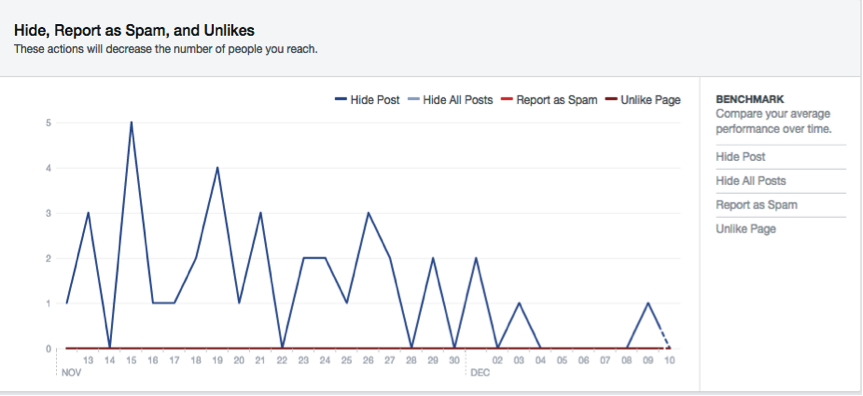
- Hide, Report as Spam, and Unlikes – The graph shows the breakdown of negative actions, such as the number of times your posts have been hidden, reported as spam, or caused someone to unlike your page. These actions will decrease the number of people you reach. `
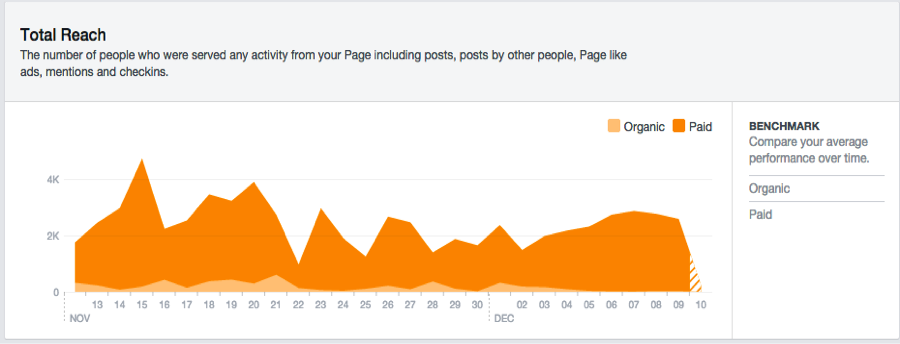
- Total Reach: Lastly, you’ll see your total reach from any activity related to your page, including posts, posts by other people, Page Like ads, mentions, and check-ins.
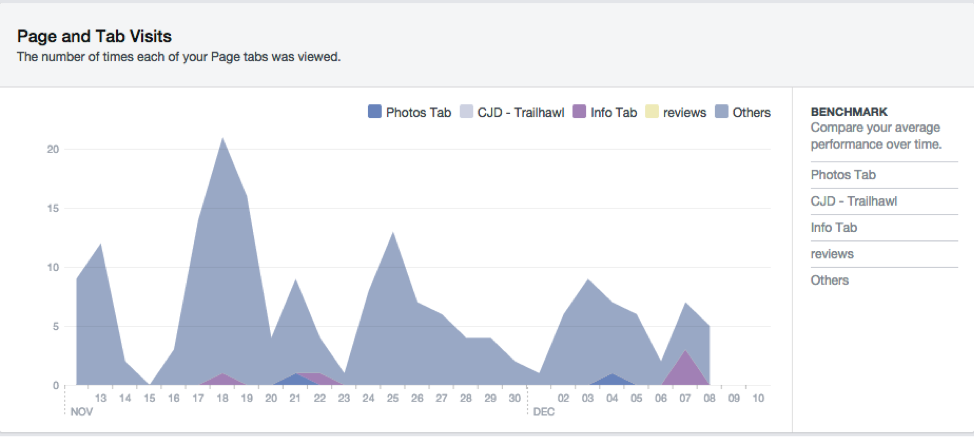
Visits:
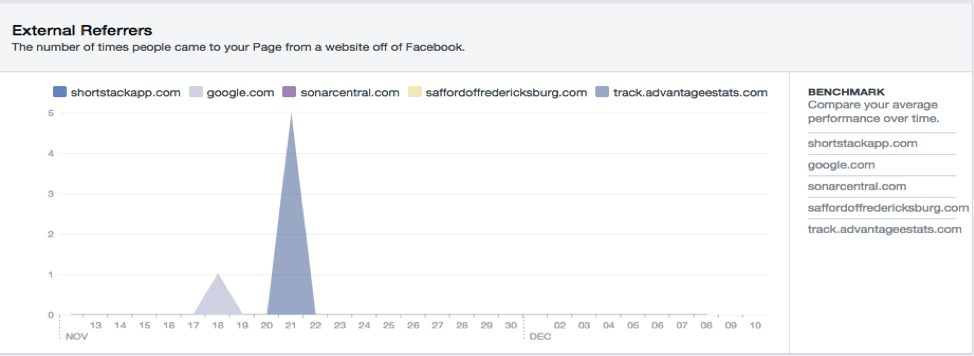
On this page you will see data for Page and Tab Visits, and External Referrers.
- Page and Tab Visits – this is where you can see the areas of your Facebook page that people visit most, including your timeline, info, and photos tabs.
- External Referrers – this shows the number of times people came to your Page from a website off of Facebook.
Posts:
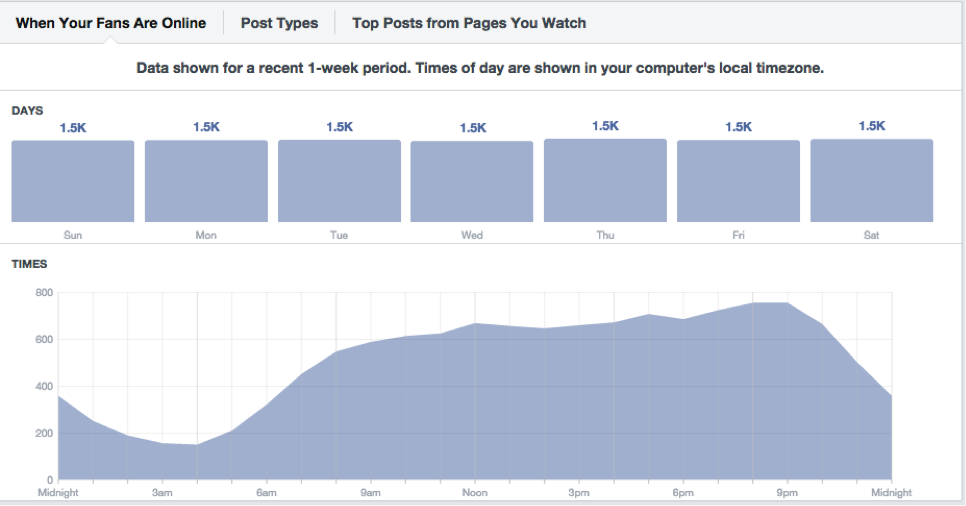
The Posts page is filled with a ton of helpful information such as, When Your Fans Are Online, Post Types, and Top Pages from Pages You Watch.
- When Your Fans Are Online – If you’re curious about when you should be posting to your Facebook Page, this is where you want to look. You’ll be able to see what days and times your fans are online – and this will help you reach more people when posting.
- Post types – Here you will see which types of posts have the most reach and engagement. The types of posts are broken down into Link, Photo, and Status. If you see that one of these types does a lot better than the others, you may want to add more of them to your page, more often.
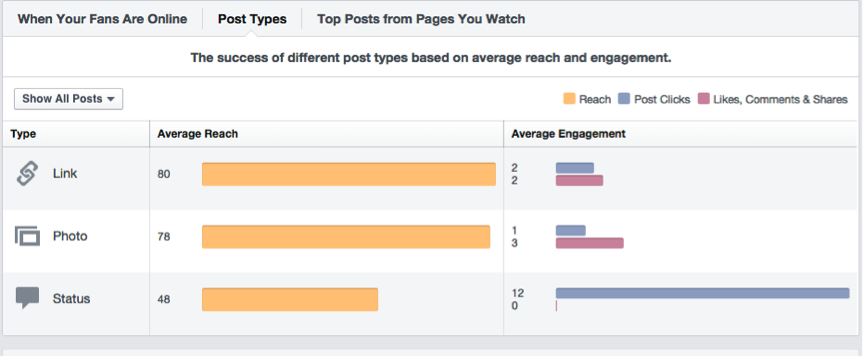
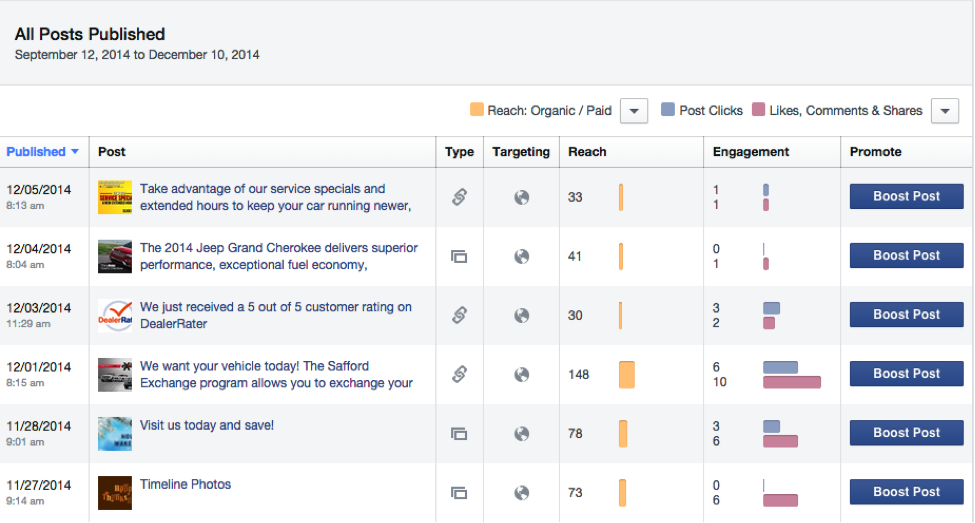
- All Posts Published – This is where you can find detailed data about of each individual post. Starting with when the post was published, a preview of the post, post type, targeting, reach, engagement, and the option to boost post. Looking at this chart makes it easy to compare the average reach and engagement from different types of posts.
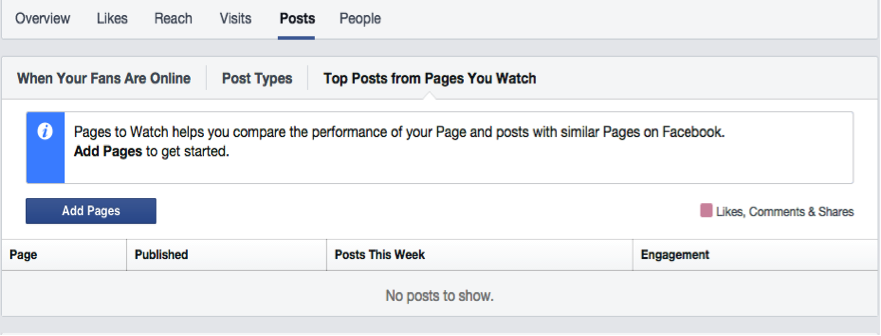
- Top Posts from Pages You Watch – Pages to Watch helps you compare the performance of your page and posts with similar Pages on Facebook. All you have to do is click “Add Pages” to get started. This is a great way to compare your posts to your competitors!
People:
It’s important to review the demographics of your page to get a better understanding of who your audience is. This tab has three sections – Your Fans, People Reach and People Engaged.
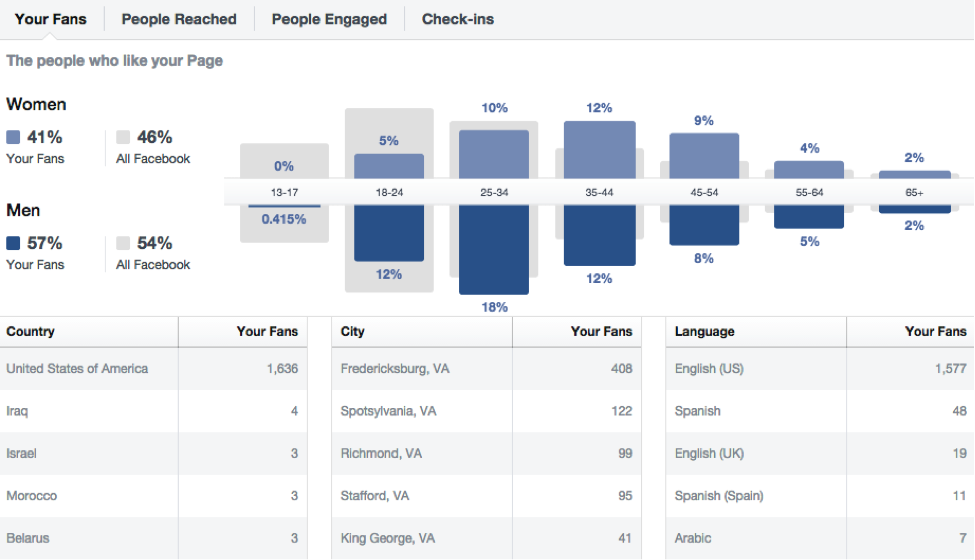
- Your Fans – here you will find the demographic information about your fans. Including their gender, country and city, and language.
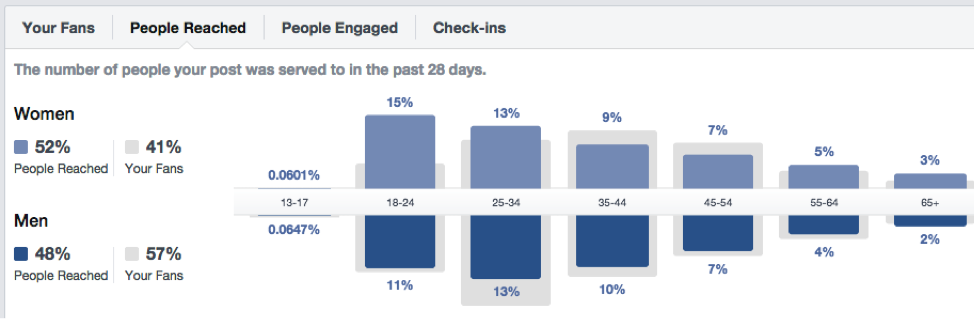
People Reached – This graph provides additional data about the demographics of people who have seen a post within the past 28 days and the demographics of those who engaged with it.
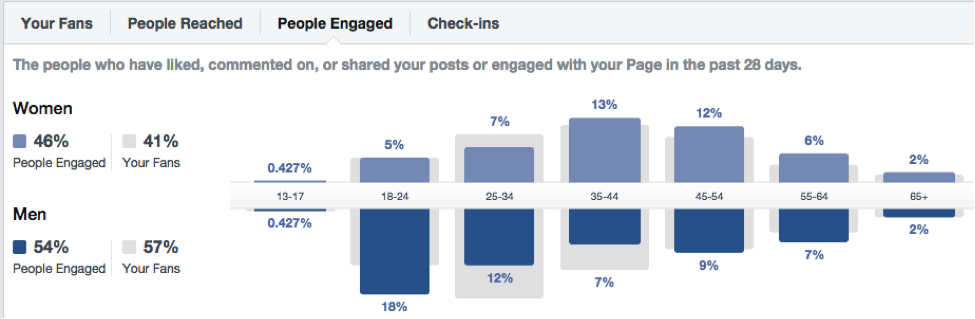
People Engaged – Looking at this graph will show you people who have liked, commented on or shared your posts or engaged with your Page in the past 28 days.
It is important to remember that the information on your Page Insights is constantly being updated so you’ll want to keep checking back at least once a month.
Now it’s your turn – get to know your fans and figure out what works best for your brand!